Looking back before we look forward
Long time readers will know that I am partial to trying to apply ideas from other fields to the world of football, particularly those from other, shall we say, more statistically advanced sports like baseball, and also from economics, whose teachings are butchered in the classroom with supply and demand curves, yet can explain so much of how we act on a daily basis. I am therefore going to quote Nate Silver's wonderful (relatively) new book The Signal and the Noise on several occasions as it perfectly describes some of the issues facing anyone trying to spot trends in football statistics and some lessons in how we should and shouldn't proceed. Silver notes that:
"When we are evaluating the success of a forecasting method, it is crucial to keep“retrodictions” and predictions separate; predicting the past is an oxymoron and obviously should not be counted among successes"
So far this year, as we've started to roll out the new forecast model, a lot of the posts around here have focused on identifying what factors have predicted the past well, looking at the correlation between shots and goals, chances created and assists etc. Soon then we're going to look at the how the model has actually performed predicting the future, starting in GW8 when (a) the model went live and (b) we (arguably) had a sufficient sample size to base predictions on.
First though, I want to present one quick 'retrodiction' which shows actual points scored to date versus xG calculated as of today. That measure looks at shots inside (SiB) and outside the box (SoB) and then 'converts' them to shots on target (SoT) using the player's individual ability and then into goals using the league average rate. For assists, chances created are 'converted' into assists using the players' team's average conversion rate.
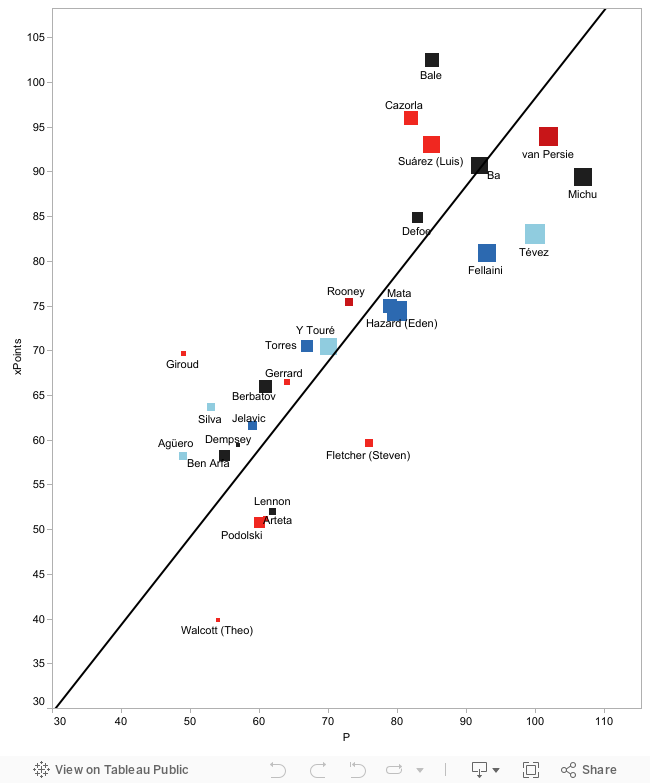 Note: The size of each square represents the player's ownership numbers as of GW16.
The good news is that we see a pretty strong correlation (74% r-squared) between actual and expected points, but still see some outliers who could be considered candidates to regress one way or the other.
Those players 'above the line' have underperformed their underlying stats for one reason or another while those below have exceeded expectations. I wouldn't go so far as to say it's as simple as those below being likely to regress negatively and those above being poised for success, but I would suggest that the outliers are a good place to start for further analysis.
Over the weekend I'm going to highlight a number of these players, whose stats provide good examples of where the model differs to reality, before leading into our review of the weekly predictions put out by the model, starting with possibly the biggest outlier so far: Michu.
The model's views on Michu have been made clear before, particularly in this week's fanning the flames:
"[Michu's] 57% G/SoT% rates is simply astonishing. For some perspective, consider that in La Liga, Leo Messi's rate over the last five years is 45% (incredibly high) and his best season was last year's 50(!) goal effort, which came on 99 SoT (51% G/SoT). Ronaldo's rate at Real Madrid has been 36% while his best season at United was 32%".
What the graph does show however is that despite the unsustainable conversion rate, Michu has still been excellent and his success at the forecast level would still more than justify a 6.5m price tag. At 8.0m however, it becomes a bit trickier. His 89 xP are still excellent but he's yet to miss a game this season, is hitting the target with 44% of his shots (a very high rate with no historic data to back it up) and carries some risk of not being deployed as a forward later in the year, none of which are accounted for in the xP number.
If you account for even some of that risk and adjust his total down to the 80 point level, then he suddenly gets within close range of the likes of Kevin Nolan, who can now be had at a 1.1m discount (and rising). Throw in his 47% ownership number and you get a player who may well be fairly valued, but probably doesn't represent a huge bargain anymore and thus might not be the answer for those working on a tight budget or looking to make up ground on their opponents.
We won't get into forecasting now, but as a quick napkin calculation to show how apparently trivial levels of regression can have a material impact, if we give Michu 18 appearances for the rest of the season (assuming he misses at least one through suspension and maybe the odd rest/injury), at his current level of production (assuming zero decline) he would rack up 39 SiB and 15 SoB. If we adjust his on target rate slightly down to a level expected for all but a handful of the league's players and then convert them to goals at a league average rate, we'd wind up with 5.3 goals for the rest of the season. Throw in a couple of assists and you end up with around 80 points from here. That's a great haul in half a season but at 4.5 PPG and a P$ of 0.564 it's hardly a total which suggests 'must own' status, especially if you're in the group needing to make, rather than hold your own ground in the standings.
I see no reason to panic if you own Michu, as this isn't a case of a player riding a lucky streak for three weeks and thus being destined for a crash any day now. However, the next six games feature four away trips (including EVE and TOT) and a home fixture with MUN, suggesting we might see some of the forecast regression in the coming weeks. The easy, and admittedly safer, solution is to simply plug Michu in and write off 8.0m, safe in the knowledge that everyone else has done the same thing, but that won't help you gain ground in your respective leagues. Just as there's always risk in making a given move, there's equal risk in inaction here and, to repeat, while there's no pressing need to sell, assuming he's a must own player and simply leaving it at that isn't advisable either.
"When we are evaluating the success of a forecasting method, it is crucial to keep“retrodictions” and predictions separate; predicting the past is an oxymoron and obviously should not be counted among successes"
So far this year, as we've started to roll out the new forecast model, a lot of the posts around here have focused on identifying what factors have predicted the past well, looking at the correlation between shots and goals, chances created and assists etc. Soon then we're going to look at the how the model has actually performed predicting the future, starting in GW8 when (a) the model went live and (b) we (arguably) had a sufficient sample size to base predictions on.
First though, I want to present one quick 'retrodiction' which shows actual points scored to date versus xG calculated as of today. That measure looks at shots inside (SiB) and outside the box (SoB) and then 'converts' them to shots on target (SoT) using the player's individual ability and then into goals using the league average rate. For assists, chances created are 'converted' into assists using the players' team's average conversion rate.
The good news is that we see a pretty strong correlation (74% r-squared) between actual and expected points, but still see some outliers who could be considered candidates to regress one way or the other.
Those players 'above the line' have underperformed their underlying stats for one reason or another while those below have exceeded expectations. I wouldn't go so far as to say it's as simple as those below being likely to regress negatively and those above being poised for success, but I would suggest that the outliers are a good place to start for further analysis.
Over the weekend I'm going to highlight a number of these players, whose stats provide good examples of where the model differs to reality, before leading into our review of the weekly predictions put out by the model, starting with possibly the biggest outlier so far: Michu.
The model's views on Michu have been made clear before, particularly in this week's fanning the flames:
"[Michu's] 57% G/SoT% rates is simply astonishing. For some perspective, consider that in La Liga, Leo Messi's rate over the last five years is 45% (incredibly high) and his best season was last year's 50(!) goal effort, which came on 99 SoT (51% G/SoT). Ronaldo's rate at Real Madrid has been 36% while his best season at United was 32%".
What the graph does show however is that despite the unsustainable conversion rate, Michu has still been excellent and his success at the forecast level would still more than justify a 6.5m price tag. At 8.0m however, it becomes a bit trickier. His 89 xP are still excellent but he's yet to miss a game this season, is hitting the target with 44% of his shots (a very high rate with no historic data to back it up) and carries some risk of not being deployed as a forward later in the year, none of which are accounted for in the xP number.
If you account for even some of that risk and adjust his total down to the 80 point level, then he suddenly gets within close range of the likes of Kevin Nolan, who can now be had at a 1.1m discount (and rising). Throw in his 47% ownership number and you get a player who may well be fairly valued, but probably doesn't represent a huge bargain anymore and thus might not be the answer for those working on a tight budget or looking to make up ground on their opponents.
We won't get into forecasting now, but as a quick napkin calculation to show how apparently trivial levels of regression can have a material impact, if we give Michu 18 appearances for the rest of the season (assuming he misses at least one through suspension and maybe the odd rest/injury), at his current level of production (assuming zero decline) he would rack up 39 SiB and 15 SoB. If we adjust his on target rate slightly down to a level expected for all but a handful of the league's players and then convert them to goals at a league average rate, we'd wind up with 5.3 goals for the rest of the season. Throw in a couple of assists and you end up with around 80 points from here. That's a great haul in half a season but at 4.5 PPG and a P$ of 0.564 it's hardly a total which suggests 'must own' status, especially if you're in the group needing to make, rather than hold your own ground in the standings.
I see no reason to panic if you own Michu, as this isn't a case of a player riding a lucky streak for three weeks and thus being destined for a crash any day now. However, the next six games feature four away trips (including EVE and TOT) and a home fixture with MUN, suggesting we might see some of the forecast regression in the coming weeks. The easy, and admittedly safer, solution is to simply plug Michu in and write off 8.0m, safe in the knowledge that everyone else has done the same thing, but that won't help you gain ground in your respective leagues. Just as there's always risk in making a given move, there's equal risk in inaction here and, to repeat, while there's no pressing need to sell, assuming he's a must own player and simply leaving it at that isn't advisable either.

Comments
Could it be that some unaccounted for variable that Michu excels in is causing this "unsustainable conversion rate"?
An excellent piece of analysis, you are a constant inspiration for us Fantasy addicts.
Presumably you haven't done so because Nolan's xP and P are pretty similar?
Like Michu, Nolan is yet to miss a game this season and runs the risk of suspension, injury etc as all players do. At 36%, his G/SoT% this season is the same as Ronaldo's which you highlighted as an elite conversion rate, so he could well be due for regression here.
Knock 10% off his xP as you did for Michu and you get a xP comparison of 80 vs 62, which may well justify the 1.1m cost differential.